Every Minute on the Floor
What Each Client Actually Costs to Serve
How to record who did what, and when, in a building where people move between clients all day. How to set the standard behind every handling rate. And how to check the floor against the quote, client by client, before the renewal does it for you.
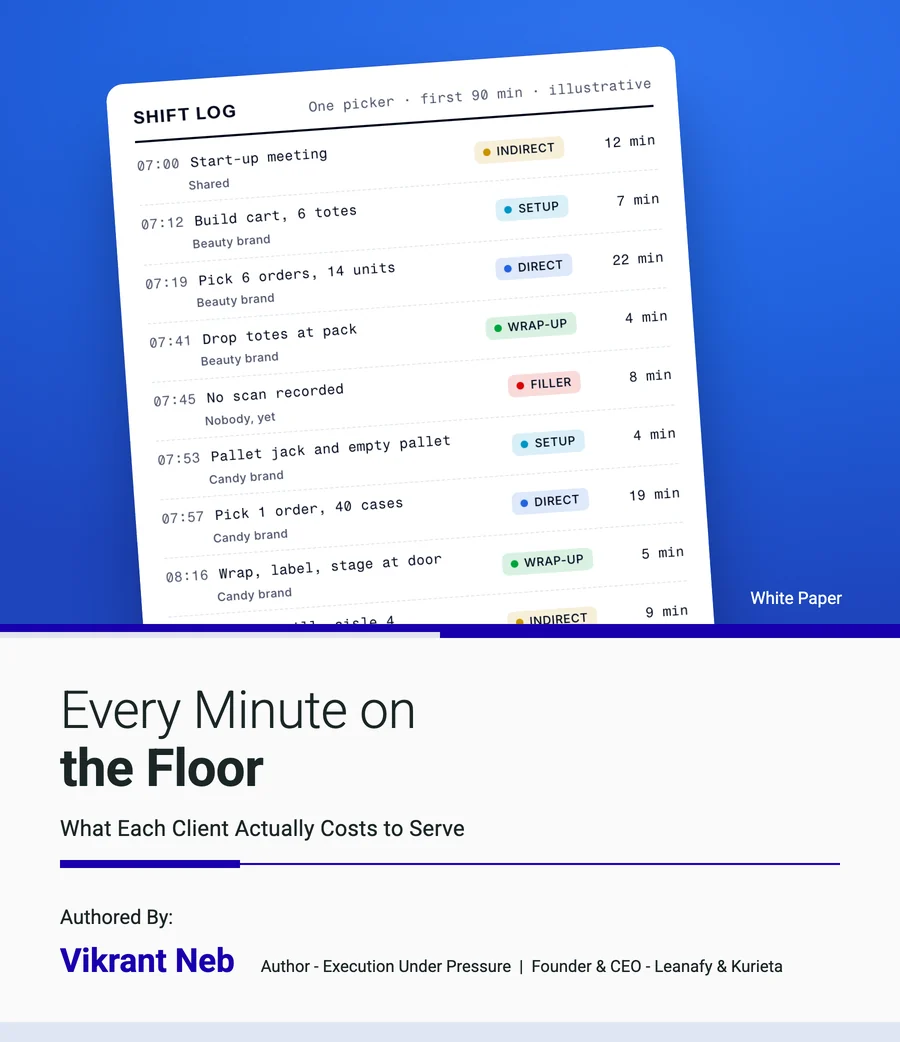
About this paper
A quote is a hypothesis. It assumes how long each activity takes, what each client’s orders look like, and how much volume will come. The floor tests that hypothesis every day, but in a multi-client building nobody reads the result, because labor is recorded for the building and not for the client. Record who did what, when and for whom. Assign the time between tasks by a rule. Compare each client’s minutes with the minutes you priced. The gap tells you whether the problem is volume, mix, productivity or work you never billed, and each one has a different fix.
Every rate on a rate card is a guess about minutes. The floor keeps the real count. Most operators never put the two side by side.
Shift log · One picker · first 90 min · illustrative
| 07:00 | Start-up meeting | Shared | Indirect | 12 min |
| 07:12 | Build cart, 6 totes | Beauty brand | Setup | 7 min |
| 07:19 | Pick 6 orders, 14 units | Beauty brand | Direct | 22 min |
| 07:41 | Drop totes at pack | Beauty brand | Wrap-up | 4 min |
| 07:45 | No scan recorded | Nobody, yet | Filler | 8 min |
| 07:53 | Pallet jack and empty pallet | Candy brand | Setup | 4 min |
| 07:57 | Pick 1 order, 40 cases | Candy brand | Direct | 19 min |
| 08:16 | Wrap, label, stage at door | Candy brand | Wrap-up | 5 min |
| 08:21 | Clean spill, aisle 4 | Shared | Indirect | 9 min |
| Paid minutes | 90 min |
Beauty 33 · Candy 28 · Shared 21 · Unexplained 8. Illustrative, not any operator’s data.
- Direct Hands on the client’s product. The work the rate card describes.
- Setup Getting ready for the next task. Belongs to the client you are about to work for.
- Wrap-up Finishing the last task. Belongs to the client you just worked for.
- Indirect Meetings, cleaning, breaks, training. Shared, and spread by a rule you write down.
- Filler Paid time with nothing recorded. Not a cost to allocate. A question to answer.
Why This Paper
“Every rate on a rate card is a guess about minutes. The floor keeps the real count. Most operators never put the two side by side.”
The pricing gut check at the end of Paper 02 started with a simple ask: rank your accounts by revenue, then estimate what each one actually costs to serve. If you cannot do it at all, that is the finding. The companion paper asked the same thing a different way: is the cost behind your rate recorded, coded to the client and the activity, not just to the building?
Both papers pointed at the same gap and stopped there. Paper 02 called it a lack of a mechanism. This paper is the mechanism.
It covers four things. Where the standard behind a handling rate comes from. How to record who did what, and when, in a building where the same person works for three clients before lunch. How to compare what the floor actually did with what the quote assumed. And what to do with the gap once you can see it, during the contract and at renewal.
I wrote it for operators running more than one kind of work under one roof: e-commerce, pallet in and pallet out, cross-dock, kitting and contract packing. The method is the same for all of them. The unit of work changes.
One caveat before we start. This is a framework, not a checklist. A 3PL in its first year in a hundred-thousand-square-foot building and an operator doing a hundred million in revenue will not apply it the same way. The larger operator may have engineers, a labor system and contracts with review clauses. The smaller one may have a spreadsheet and a supervisor with a good memory. Both can start. They will start in different places.
The Quote Is a Hypothesis
The companion paper took a quote apart into three layers: a cost base, a volume model and a set of assumptions. Every handling rate sits on all three, and underneath it is one more number nobody prints on the proposal. Minutes.
A pick fee of fifty cents is really a statement like this: a unit takes about this many seconds to pick, a fully loaded hour costs about this much, and the order profile will look the way the client described it. Change any of those three and the fifty cents means something else.
- Input 1Minutes per unitThe standard. How long the work should take, with an allowance.
- Input 2Cost per hourFully loaded labor, on the same hour basis as the standard.
- Input 3The profileUnits and lines per order, case weight, volume. What the client said.
- ResultThe rateA cost per unit, plus margin. Only true while all three hold.
The first thing to settle is the unit of work, because it changes by business type. Orders per hour means something for a skincare brand. It means very little for a client shipping forty-case pallets to a grocery chain.
| Business type | Unit of work | What drives the minutes |
|---|---|---|
| E-commerce | Orders, lines and units | Lines per order (each line is a walk), units per order (each unit is a reach), packaging and inserts |
| B2B, pallet in and out | Pallets in and out, cases picked | Floor-loaded versus palletized, case weight, mixed versus single-SKU pallets, retail labeling |
| Cross-dock | Pallets or cartons touched, time on the floor | Breakdown and sort, how long freight sits before it leaves |
| Kitting and co-pack | Kits or units built, by work order type | Components per kit, setup per run, run length |
Two clients, one building
To keep this concrete, the rest of the paper follows two illustrative clients through the same building. Neither is real. The numbers are rounded to make the math readable.
| As quoted | The beauty brand | The candy brand |
|---|---|---|
| Channel | E-commerce, direct to consumer | B2B, cases to regional retailers |
| Volume | About 12,000 orders a month | About 30,000 cases a month, roughly 750 orders |
| Profile | 2 lines and 3 units per order, small items, one mailer | 8 lines and 40 cases per order, one pallet out, best-before tracked |
| Unit of work | Orders | Cases |
| Labor | $26 an hour fully loaded, for both. Same people, same building, same shift. |
Same building, same people, same hourly cost. Two completely different kinds of work. If the only number you track is total labor hours against total volume, these two clients are invisible inside each other.
Where the Standard Comes From
A standard is the time an activity should take, done the agreed way, by a trained person, with an allowance for the things that happen to every person on every shift. There are three ways to get one, and most operators only use the last.
| Method | How it works | Strength | Watch out for |
|---|---|---|---|
| Engineered | Break the task into small motions and add up published times for each. Industrial engineers use systems such as MTM and MOST for this. | Holds up when someone asks you to explain the number. Can be built before the client ever ships. | Takes skill and time. Assumes the job is done the designed way. |
| Your own history | Units done divided by hours spent, from your own floor, on similar work. | Real. Your building, your people. | Includes every bad habit and badly slotted aisle you already have. |
| Estimate | Someone experienced says what it should take. | Fast. Often close for familiar work. | Nobody can say where it came from a year later. |
You do not need a motion study for every activity. You need to know which of the three your number came from, and write it down next to the number. A standard you cannot explain is an opinion.
The allowance
No one works at the pace of a stopwatch for eight hours. Every standard adds an allowance on top of the task time, for personal needs, fatigue and small unavoidable delays. Fifteen percent is a common starting point. Heavier work, colder rooms and longer reaches get more. The allowance is part of the hypothesis too, and later in this paper we will measure it by client.
Building the beauty brand’s standard
Here is the quoted standard for one beauty order, built from rounded seconds per step. It is not a science project. It is five or six steps per activity, each with a number someone can argue with. Move the sliders to see what happens when the order profile changes after signing.
Exhibit A · Illustrative
The minutes inside one beauty order
- Seconds per order
- 107
- Orders per productive hour
- 33.7
- Labor per order
- $0.91
This is the order the quote described: about $0.91 of labor.
| Step | Sec | Per order |
|---|---|---|
| Pick · scan order, set tote | 6 | 6 |
| Pick · travel to location | 12 | 24 |
| Pick · scan location | 3 | 6 |
| Pick · pick and scan unit | 4 | 12 |
| Pick · place in tote | 2 | 6 |
| Pack · scan tote, build mailer | 10 | 10 |
| Pack · place units | 3 | 9 |
| Pack · slip and insert | 3 | 3 |
| Pack · seal, label, set out | 17 | 17 |
| Allowance, 15% | 13.9 | |
| Standard per order | 106.9 |
At the quoted profile, an order takes about 107 seconds of pick and pack time, or roughly 34 orders per productive hour. Push the profile to the kind of bundled orders a brand starts sending after a promotion, and the same rate card is describing a very different amount of work.
Building the candy brand’s standard
The candy brand is built the same way, in cases instead of orders. Two things change. The unit of work is the case, because a forty-case order and a twelve-case order are not the same work. And the allowance is higher, because lifting cases all shift is more tiring than picking lipsticks.
Exhibit B · Illustrative
One candy order, forty cases, one pallet
| Step | Sec | Per | Per order |
|---|---|---|---|
| Get order, pallet jack, empty pallet | 120 | order | 120 |
| Travel to location | 25 | line | 200 |
| Scan location, check best-before date | 6 | line | 48 |
| Pick and stack case | 10 | case | 400 |
| Wrap pallet, apply retail label, stage | 210 | order | 210 |
| Task time, before allowance | 978 |
- Allowance
- 18%
- Seconds per case
- 28.9
- Cases per productive hour
- 125
About $0.245 of labor per case. The unit of work is the case, not the order.
Every row in both tables is an assumption. Twenty-five seconds of travel per line assumes the candy sits where the quote assumed it would sit. Four seconds per beauty unit assumes the shades are slotted so pickers are not squinting at near-identical labels. When those assumptions break, the floor will tell you. The question is whether anyone is listening.
The hour basis trap
One mistake is common enough to call out on its own. A standard is measured in productive time, the minutes someone is actually on a task. Labor cost is paid by the hour, and paid hours include meetings, breaks, cleaning and everything else that is not a task. If you divide a paid-hour cost by a productive-hour standard, you underprice every unit.
| Beauty order, at quote | Labor per order |
|---|---|
| $26 a paid hour ÷ 33.7 orders per productive hour | $0.77 |
| Same, with only 85% of paid hours on measured work | $0.91 |
| Underpriced on every order | 15% |
Pick one basis and state it next to every standard. Productive hours with the non-task share loaded into the cost, or paid hours with it loaded into the standard. Either works. Mixing them does not.
Why the Floor Never Matches
The day a client goes live, the standard and the floor start to separate. Not because anyone did anything wrong. Because a warehouse with more than one client does not work the way a standard imagines.
- People move between clients. A picker finishes a beauty batch, helps load a candy truck, then cleans an aisle. Each switch carries a few minutes nobody priced.
- Tasks interleave. A forklift driver puts away for one client and picks for another on the same trip. Good for the building. Hard to split.
- Setup and wrap-up are real work. Building a cart, finding a pallet jack, dropping totes at pack. They rarely appear in a standard and always appear on the floor.
- The profile drifts. Units per order climb with bundles and promotions. Case weights change with a new product line. SKU counts grow.
- The process changes. A client adds a sample, a thank-you card or a new label. Each one is a new step at the pack station.
- Volume moves. Up with a sale, down when a retailer drops the line. In Execution Under Pressure I described a 3PL that onboarded an e-commerce client with a backlog of about thirty thousand orders, against a normal pace of five to six hundred a day. No standard survives that intact.
Picture the beauty brand three months in. Marketing starts adding a sample sachet to every order. The account manager says yes on a call. Nobody updates the standard and nobody adds a line to the rate card. It is three seconds an order. At twelve thousand orders a month, it is ten hours of labor a month that the quote never saw, and it will not show up anywhere unless the pack step is timed.
A standard does not tell you what happened. It tells you what you assumed would happen. You need both numbers.
Who Did What, and When
Everything in this paper depends on one habit: every task records who did it, for which client, when it started and when it ended.
Most of this can come from scans the floor already makes. A picker scans an order to start and a location to finish. A receiver opens and closes a receipt. The timestamps are already there. What is usually missing is the work between scans, and the rules for whose time it is.
What to record
Start with the activities that carry most of your hours. For most operators that is receiving, put-away, picking and packing. Add the rest as you go.
| Group | Activity | Timer starts | Timer stops | Unit |
|---|---|---|---|---|
| Inbound | Unload | Door assigned | Last pallet or carton off | Pallet, carton, container |
| Receive and count | First scan on the receipt | Receipt closed | Line, carton, unit | |
| Label and prep | First label | Last label | Unit, carton | |
| Put-away | Pallet or tote picked up | Location scanned | Pallet, tote | |
| Storage | Replenish | Task opened | Pick face scanned | Pallet, case |
| Cycle count | Count started | Count submitted | Location | |
| Outbound | Pick | Batch or order started | Last pick scanned | Order, line, unit, case |
| Pack | Tote scanned | Label applied | Order, carton | |
| Pallet build and wrap | Pallet started | Pallet label applied | Pallet | |
| Load | Door scanned | Trailer closed | Pallet, carton | |
| Other direct | Kitting and VAS | Work order started | Work order completed | Kit, unit |
| Returns | Return scanned | Disposition recorded | Return, unit | |
| Indirect | Meetings, training, cleaning, breaks, waiting, looking for equipment | Logged by type, with a start and an end | Minutes |
Two notes on that table. First, a timer is not a standard. Many operators track some activities, often receiving, only in hours. That tells you how long it took. It cannot tell you whether that was good, because there is nothing to compare it to. Every timed activity needs a target next to it, even a provisional one from history. Second, define every unit in writing. A line, a unit, an SKU and a case are four different counts. A target in “SKUs per hour” means nothing until everyone agrees what was counted.
The rules for time between tasks
Scans capture the task. The minutes between tasks are where a multi-client building loses track. These rules settle most of them.
| Situation | Whose time it is | Why |
|---|---|---|
| Finishing a task: dropping totes at pack, staging a pallet, wrapping | The client you just finished | The task is not done until it is handed off |
| Getting ready for the next task: building a cart, loading totes, getting a forklift, finding a pallet | The client you are about to work for | The work would not exist without the next task |
| Paid time with nothing recorded | Nobody yet. It goes into a filler bucket | Allocating it hides it. Investigate it first |
| Travel inside a batch, between two picks for the same client | That client | It is their walk |
| Travel inside a batch, between picks for two different clients | Split equally between those two | Both caused the leg |
| Setting up a cart or batch that serves several clients | Split by totes or orders assigned | Forty orders for one client and two for another is not a fifty-fifty cart |
| Meetings, cleaning, breaks, training | A shared pool, spread by each client’s share of direct hours | Or another rule, as long as it is written down and kept |
| Returns | The client whose product came back | Logging returns as the building’s work makes that client look cheaper than it is |
Notice that none of these rules needs anyone to clock in and out of the bathroom. People are working from the start of the shift to the end. The rules only decide whose work it was. The one thing they ask of the floor is that setup and indirect work get a scan or a tap too, because a cart built without a scan is just filler with a better excuse.
Here is the same ninety minutes from the shift log at the top of this paper, extended to the full morning. First as the building sees it, then as the rules see it.
Exhibit C · Illustrative
One picker’s morning, two ways
Paid labor
- Paid minutes
- 150
- Orders shipped
- 15
- Minutes per order
- 10.0
- Unexplained
- ?
One number for two very different kinds of work. Ten minutes an order is true and tells you nothing: one of those orders was forty cases.
The building view says one hundred and fifty minutes went into fifteen orders, ten minutes an order. That number is true and useless. One of those orders was forty cases. The client view says the beauty brand used seventy-one minutes, the candy brand thirty-five, the building thirty-six, and eight minutes are unexplained. Now there is something to compare with a quote, and something to go and ask about.
One more point on batching. If a batch saves walking, the saving belongs to you. The beauty brand pays per order whether you pick its orders one at a time or twelve at a time. Paper 01 and Paper 02 made the billing side of this point with the pen example. Here is the cost side: attribute what the batch actually took, and the client that benefits from your batching will look more profitable. It should. You earned it.
One Charge, Many Activities
The companion paper mapped every charge to its trigger: what fires it, under what condition, at what unit. This section maps it the other way, to the activities underneath it and the minutes each one takes.
Take the most ordinary charge on a B2B rate card: inbound pallet handling, priced per pallet. The quote imagines one smooth motion. Unload, receive, put away. Picture the candy brand’s containers arriving late in the afternoon. The crew unloads and counts against the paperwork, stages the pallets by the door and goes home. The next morning someone receives them in the system, labels them and puts them away.
- Day 1Unload and count1.5 min a pallet. In the quote.
- Day 1Stage at the door0.5 min a pallet. Not in the quote.
- Day 2Receive and label1.5 min a pallet, including a second move.
- Day 2Put away2.5 min a pallet. In the quote.
- One chargePer pallet inQuoted at 4 minutes. Floor spends 6.
Same pallet, same rate, fifty percent more minutes, spread across two days and probably two different people. If the charge is checked against one timer, the receiving timer, nothing looks wrong. Only by adding up every activity that serves that charge do you see that the charge is underwater.
The fix starts with a map. For each client, list every activity you record and the charge that recovers it. Most will map cleanly. A few will map to nothing: the staging move, the sample sachet, the relabel nobody wrote a work order for. That short list is your unbilled work, and it is usually where the leak is.
Every activity on the floor should point to a line on the rate card. The ones that point nowhere are free.
The Allowance, Client by Client
Once tasks are timed, you can measure the allowance instead of assuming it. Take the task time the standard predicted for the work actually done. Compare it with the time the floor actually recorded. The difference, as a percentage, is the allowance that client really ran at.
Do this for the whole building and you will probably land close to what you assumed. Do it client by client and the spread is the interesting part.
Picture the beauty brand coming in at eighteen percent against a fifteen percent assumption, while the candy brand runs under its eighteen. Three points does not sound like much. It is the gap between a standard and a floor, and it is a list of things to go look at:
- Shades of the same product slotted side by side, so pickers slow down to read labels.
- Mispicks caught at pack and walked back, which count as pick time.
- Pickers waiting for empty totes because pack is backed up.
- New hires on the account who have not learned the slotting yet.
None of those is a pricing problem. Each one is a floor problem with a cost attached, and the measured allowance is how you find it. The LED client in Paper 02 was the same pattern: the cost was real, but it came from a layout decision, not the work. This is how you catch that pattern in month two instead of month twelve.
Measuring by client also tells you when the assumption itself was wrong. If the candy brand’s cases really are heavy and its allowance keeps running at twenty-two percent after the floor issues are fixed, the standard was optimistic. That is a quoting lesson for the next candy client, and maybe a conversation at this one’s renewal.
Three Comparisons
With timestamps and attribution in place, three comparisons become possible. Most operators start with the first and add the others as they get comfortable.
| Comparison | The question it answers | Who uses it |
|---|---|---|
| Target versus actual | Did the floor run at the standard we priced, for this client, this month? | Operations, weekly and monthly |
| Actual versus past months | Is this client getting better or worse? Compare like months: a peak month against last year’s peak, not against a quiet one. | Operations and account management |
| Engineered standard versus your target | Was the number in the quote right in the first place? Useful when the target came from history or an estimate. | Whoever quotes, at renewal and for the next similar client |
The third comparison is optional, and it is the hardest. It is also the only one that tells you whether your quotes are systematically generous. If your history-based targets keep coming in well below what an engineered standard says the work should take, you are pricing your own inefficiency into every new client. The companion paper made that point about cost. This is where you measure it.
Reading the Gap
When a client’s actual minutes run over its quoted minutes, the first instinct is to blame the floor. Sometimes that is right. Often it is not. The gap usually comes from one of five places, and each needs a different fix.
| Cause | What it looks like | The fix |
|---|---|---|
| Volume | Fewer or more units than quoted. Labor flexes, but the fixed cost carried for the client does not. | Minimums, volume bands, a price for the next step |
| Mix | Units or lines per order, case weight or SKU count moved away from the quote | Reset the standard, reprice at the agreed band |
| Productivity | Same work, more time. Allowance creeping up, slotting, training, congestion | Fix the floor, not the price |
| Unbilled work | Activities with no charge behind them: inserts, staging, relabels, extra moves | Add the charge, or a change order before the work starts |
| Outside costs | Consumables, cartons, shrink wrap, pallets rising in price | Pass-through or a materials line, as the companion paper covered |
The order matters. Separate mix from productivity before you talk to anyone. If the beauty brand’s orders went from three units to four and a half, the floor did not get slower. The work got bigger. Coach the pickers for that and you will lose a good team for nothing.
Here is the beauty brand’s gap at month three, taken apart.
Exhibit D · Illustrative
The beauty brand: from 107 seconds an order to 139
- Quoted labor per order
- $0.91
- Actual labor per order
- $1.18
- Of the gap, caused by mix
- 78%
Most of the gap is mix. The client is sending bigger orders than it described, which the rate card partly recovers through the per-unit fee, but not at the standard the quote assumed. A smaller part is productivity, which is the floor’s to fix. And a sliver is the sachet, which is nobody’s fault and everybody’s cost until it becomes a line on the invoice.
The candy brand shows a different cause entirely. Its minutes per case are better than quoted. Its problem is volume: one of its retailers dropped the line, and it is shipping about twenty-one thousand cases a month against the thirty thousand it described. Labor shrinks with the volume. The dedicated space sized for it, the account time and the share of supervision do not. Same building, same month, two clients, two different gaps.
The Numbers to Watch
Here is a working set. Not every operator needs all of them on day one. Start with the activity and client rows, and add drift and floor health once the timestamps are trusted.
| Level | Measure | What it tells you |
|---|---|---|
| Per activity | Units per productive hour, by activity, against target | Whether each piece of work runs at the standard behind its charge |
| Measured allowance | How much of the gap is the floor, client by client | |
| Per client | Labor cost per order, per line, per unit or per case | The number the quote assumed, now measured |
| Attainment: quoted minutes ÷ actual minutes | One figure per client per month. Under 100% means the quote was generous to the client | |
| Handling revenue per labor hour | What an hour on this client earns, compared with what it costs | |
| Unbilled minutes | Time on activities that map to no charge | |
| Profile drift | Units per order, lines per order, case weight, SKU count, against the quote | The early warning. Drift shows up here months before it shows up in margin |
| Floor health | Share of paid hours on measured work | Whether the hour basis in your quotes still holds |
| Filler minutes, indirect share, overtime share | Where paid time goes when it is not on a task |
Two cautions. A measure without its unit definition is a rumor, so write the definitions next to the numbers. And orders per hour, on its own, cannot compare two clients or two months. Always show it next to the profile it was measured on. A team that drops from thirty-four orders an hour to twenty-six while units per order went from three to four and a half did not get worse.
One Building, Two Clients
Put the two clients together at month three. The building’s payroll budget was set from the quotes: twelve thousand beauty orders and thirty thousand candy cases at their quoted standards. Then look at what actually happened, first the way most operators see it, then client by client.
Exhibit E · Illustrative
Month three, two ways
| Building | Budget | Actual | Variance |
|---|---|---|---|
| Handling labor, both clients | $18,259 | $18,170 | -0.5% |
Payroll landed within one percent of budget. On this report, month three looks like a good month.
In the building view, payroll landed within one percent of budget. Nobody calls a meeting about that. In the client view, the beauty brand is costing thirty percent more labor per order than quoted, about three thousand dollars a month on its current volume, and the candy brand is shipping thirty percent fewer cases than it described. The two problems cancel out on the payroll report. They do not cancel out in the margin.
This is the averages problem from Paper 02, one level down. That paper showed four accounts out of twenty hiding inside a healthy P&L. This shows the same thing happening inside a healthy labor report, which is the report most operators actually look at every week.
On the payroll report, the two problems cancelled out. In the margin, they added up.
Acting on What You Find
Knowing the gap is half the work. What you can do about it depends on where you are in the contract.
During the contract
If you signed a rate for a year and your quote was wrong, that is mostly your loss to carry until the renewal. The data still matters. It lets you have an honest conversation now instead of a surprising one later: here is what you told us your orders would look like, here is what they look like, here is what that does to the work. Most clients do not know their own profile drifted. Showing them is not a threat. It is information they need too.
And the floor-side causes, productivity and unbilled work, are yours to fix today, whatever the contract says.
At renewal
At renewal the data is your evidence. A renewal built on twelve months of attributed minutes per client is a different conversation from one built on a feeling that the account is hard. The companion paper covered why growth does not automatically earn a discount. Attributed minutes are how you show where the client’s growth actually landed.
Write the triggers in before you need them
The best time to agree what happens when the profile changes is before it changes, in the proposal the client signs. These examples are a starting point, not a complete list, and the right terms depend on your stage, your market and the client.
| Trigger | Example | What the contract can say |
|---|---|---|
| Volume well below quote | Quoted at about a thousand orders a day, running at two hundred | A monthly minimum, or rates that step up below an agreed floor |
| A short spike | A sale takes one day from a thousand orders to three thousand | Treated as a special project: notice period, overtime or project rate |
| Sustained growth | Volume doubles and stays there for a quarter | A capacity review. If it needs another pack station, equipment or space, that step is priced before it is added |
| Profile drift | Units or lines per order move outside an agreed band | Standards and rates reset at the next scheduled review |
| Process change | A new insert, label, kit or inspection step | A change order, priced from a new standard before the change goes live |
When growth costs more than it earns
Growth deserves its own note, because it is the one clients expect to be rewarded for. Picture the beauty brand doubling from a thousand orders a day to two thousand. Today its packing fits on about one and a half pack stations. At two thousand, it needs another one and a half, plus the space around them, plus maybe another lift for replenishment. Some of that is fixed cost the quote spread across the old volume. Some of it is new. And if the space for those stations comes out of another client’s area, the cost lands somewhere you were not looking.
Before you build for one client’s growth, it is worth asking whether you have to. A neighbor with space and the same kind of work can sometimes take overflow for a season. That keeps the client served and buys time before you commit to a step you cannot undo.
What To Do This Week
Paper 02 ended with a pricing gut check and the companion with a rate card gut check. This one is a minutes gut check. Pick one client, ideally your largest or the one that feels hardest, and do these for that client only.
Write down the standard behind its handling rates.
Minutes per unit, the allowance, the hour basis, the profile it assumed, and where each number came from. If you cannot, that is the finding.
Define the units.
What counts as an order, a line, a unit and a case for this client. Write it where the floor and billing can both see it.
Turn one timer into a standard.
Find an activity you track only in hours. Set a provisional target from three months of history, so next month has something to be compared with.
Attribute one week.
Code a week of labor by client and activity, using the rules in section 05. Put unrecorded time in a filler bucket and measure how big it is.
Compare the profile.
Units per order, lines per order, case weight and volume this month, against the quote. Mark anything that moved.
Map activities to charges.
List every activity you did for this client last month and the charge that recovers it. Circle the ones that map to nothing.
None of this changes a rate. It tells you whether the rate still describes the work, and where to look first if it does not.
Closing Thoughts
A 3PL sells minutes and bills for events. The rate card turns one into the other through a set of assumptions: how long the work takes, what the client’s orders look like, how much will come. On the day the quote is signed, those assumptions are the best information anyone has. By month three they are a hypothesis the floor has been testing every day.
In a building with one client, you would see the result without trying. In a building with twenty, you only see it if you record who did what, for whom and when, and decide in advance whose time the in-between minutes are. Do that, and the payroll report stops being one number. It becomes twenty, and each one can be checked against the quote that produced it.
Price the minutes. Record the minutes. Then compare the two, one client at a time.
I am always glad to compare notes on standards, timestamps and the minutes in between.
Where This Series Goes Next
This is a companion to the second paper in a series of operator-focused field guides for 3PLs scaling into fulfillment.
The Integration Moat
API and EDI architecture as a competitive advantage. How leading 3PLs onboard brands in a week, what the right integration stack looks like at each volume stage, and why integration breadth beats integration depth for most operators.
Labor That Survives a 5x Swing
Cross-training, temp-staffing partnerships, peak-season planning, and the design choices that make labor interchangeable.
Why the WMS Always Goes First
Vendor evaluation, implementation pitfalls, and surviving a WMS transition without losing clients.
Returns Are Reverse Manufacturing
Designing a returns operation at scale, and the technology that makes high-volume returns profitable.
Reading the Brand-Side Signals
How to detect a quiet exit before it happens.
The Fulfillment-Native 3PL
Synthesis. What the 3PL of the next decade looks like.
About the Author
Vikrant Neb is an industrial engineer who has spent his career around operations. He has run e-commerce companies, led manufacturing operations through Kurieta during his consulting years, and worked with 3PLs across the full range of volumes and transitions covered in this series.
He is the founder of Leanafy, a warehouse management system built specifically for 3PL operators, and Kurieta Operations Consulting. His book, Execution Under Pressure: The Hidden Reasons Why 3PLs Stop Growing and How to Fix Them, came out in 2026. He hosts the Execution at Scale podcast and splits his time between Indianapolis and Vancouver.
This paper covers one slice of his work, what a client actually costs to serve. He is always glad to compare notes with operators working through their own numbers.
vikrantneb.com · linkedin.com/in/vikrant-neb
Want a copy to keep or forward? Download the paper.
A note on the numbers
Every figure in this paper is illustrative. The two clients are invented, and the step times, allowances and labor rate are rounded to make the math readable. They are not benchmarks and not any operator’s standards. Engineered standards are built with predetermined motion time systems such as MTM and MOST; anyone setting standards for a contract should use a trained practitioner or a time study on their own floor.